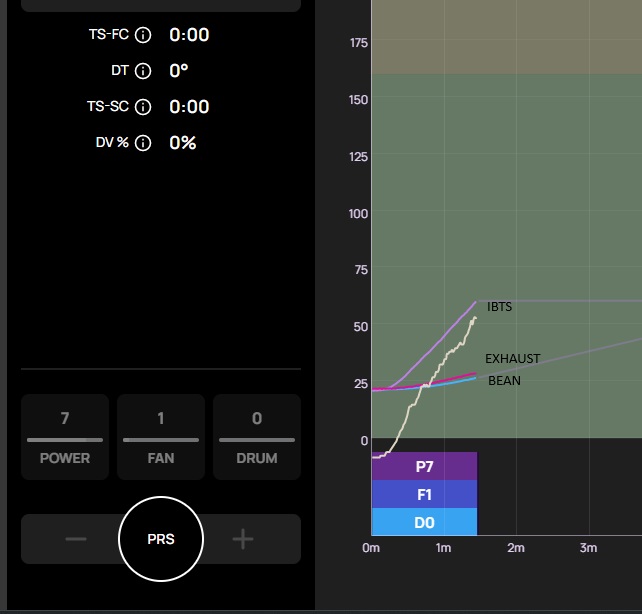
Added a K-Type probe for now and it was really interesting to see the change in temperature readings post First Crack. Having read about the ‘S-curve’ but not seeing them with the IBTS and BT curves that always go up, the impact of water vapour during/post FC, I could actually visualize the curve go down at the onset, rise and then fall again at the end.
Looking forward to learn more in my subsequent roasts. In general, learning about exhaust temperatures, I feel, will make it easier to move on to a bigger, conventional roaster, especially one that relies more on the exhaust readings.
2 Likes
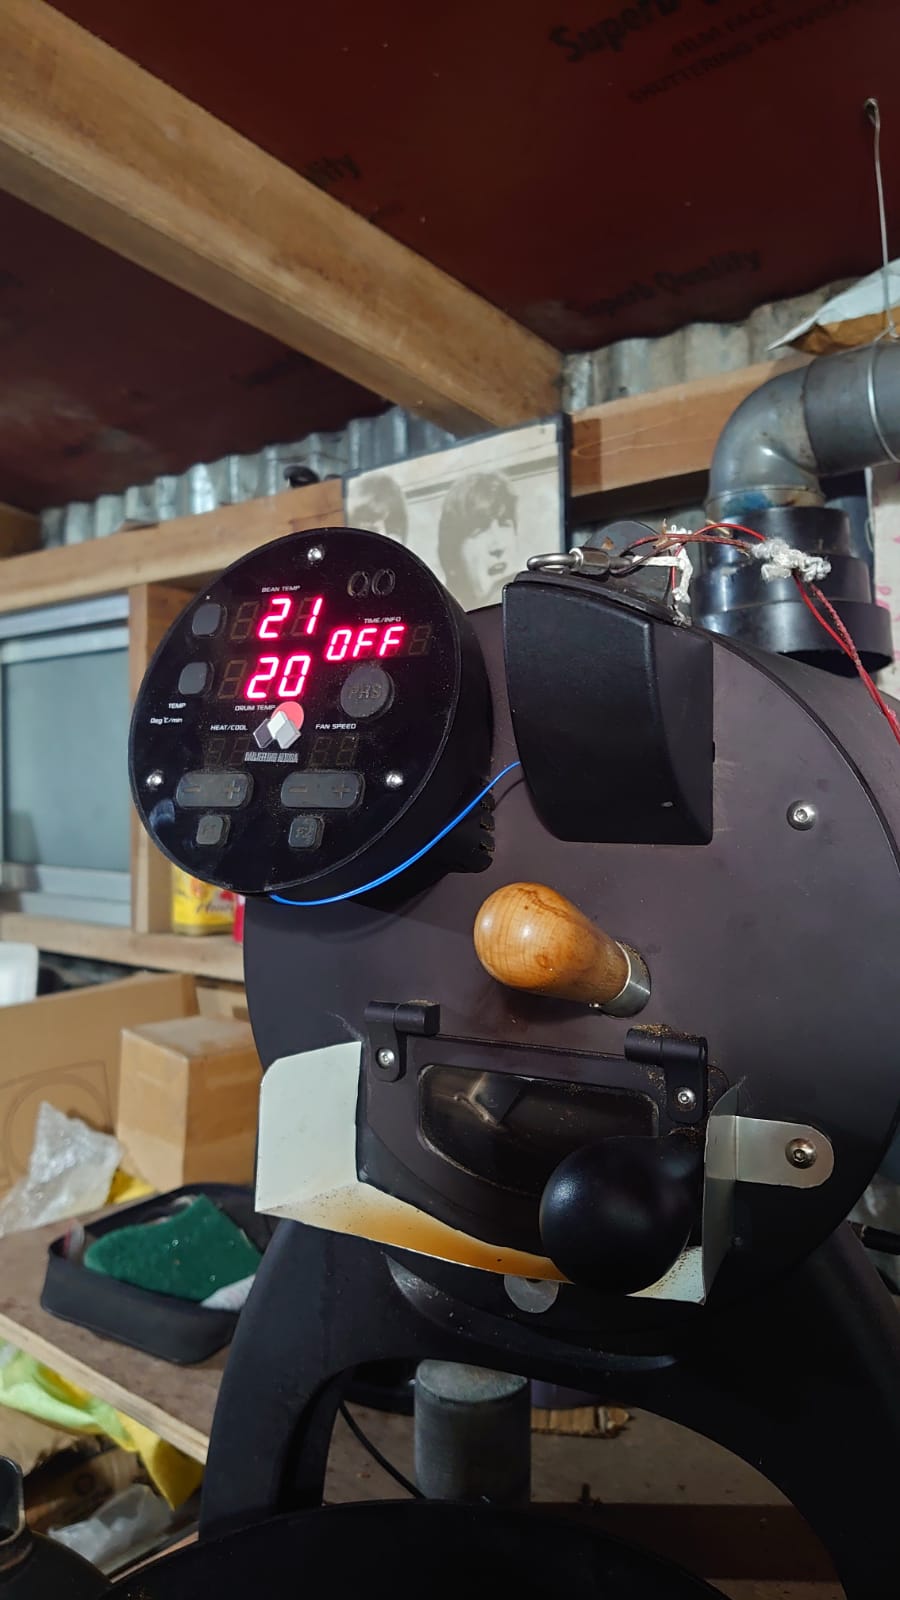
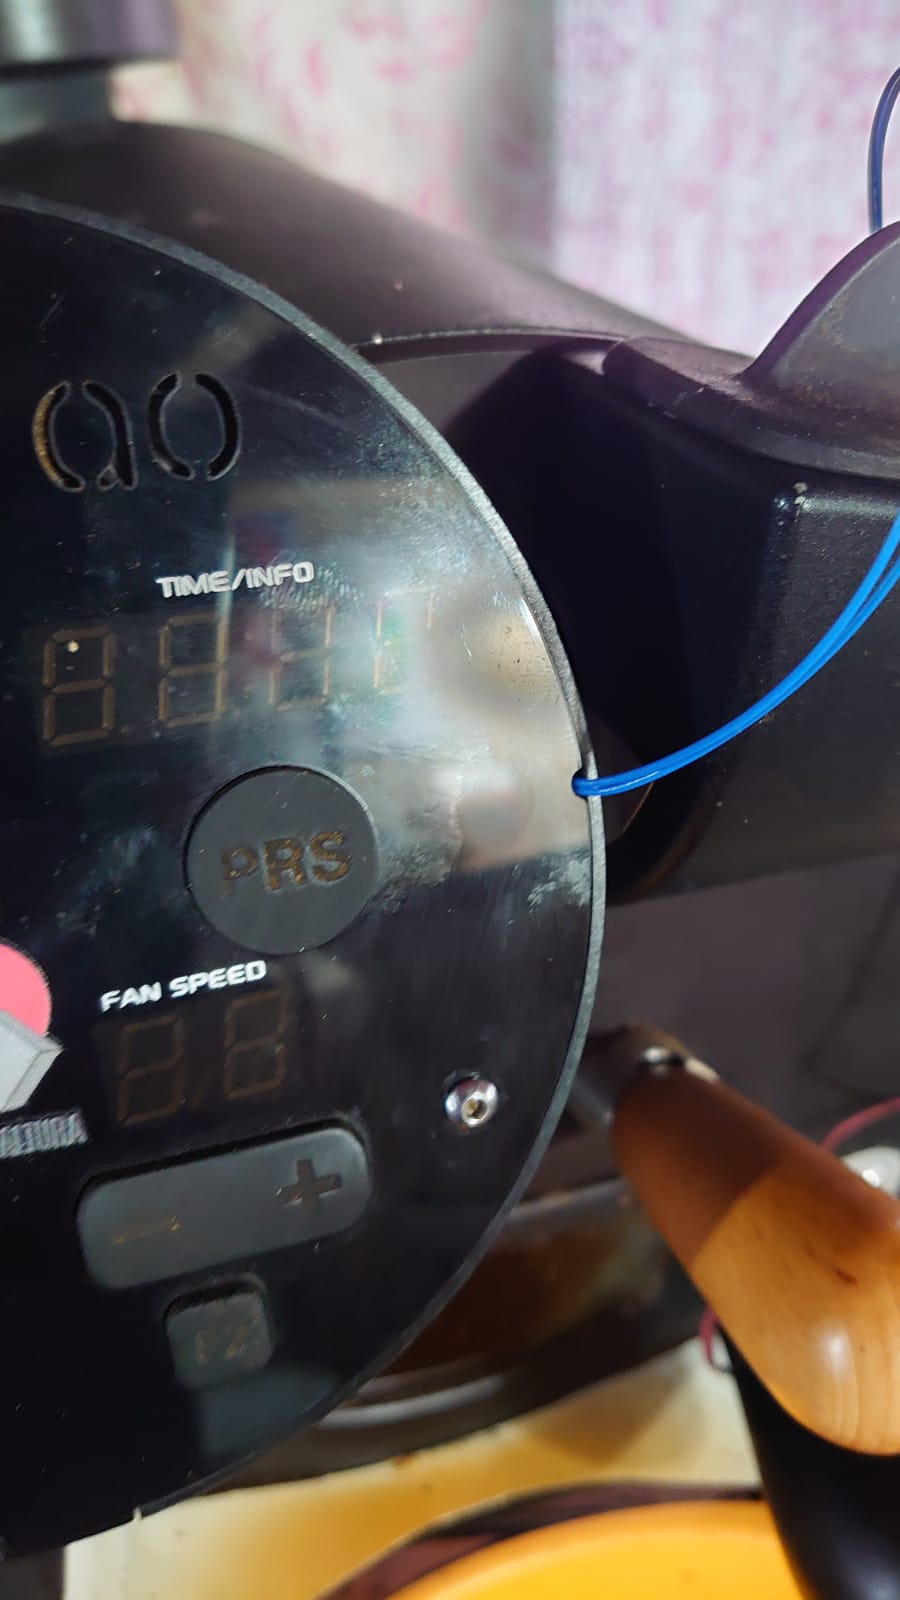
I have now added a probe to the bean chute hooked on to the air port on the control panel. I have an exhaust curve on my roast profile. Now I am desperately longing for a reading on RoastTime. I can even let go of the BT readings in favour of the Exhaust temp since my primary probe is the IBTS, so I find the bean probe redundant.
The Exhaust Air temperature appears to be far better than the IBTS or the BT in factoring in residual heat while making Power and other changes to meet time based phase targets, especially Maillard.
UPDATE:
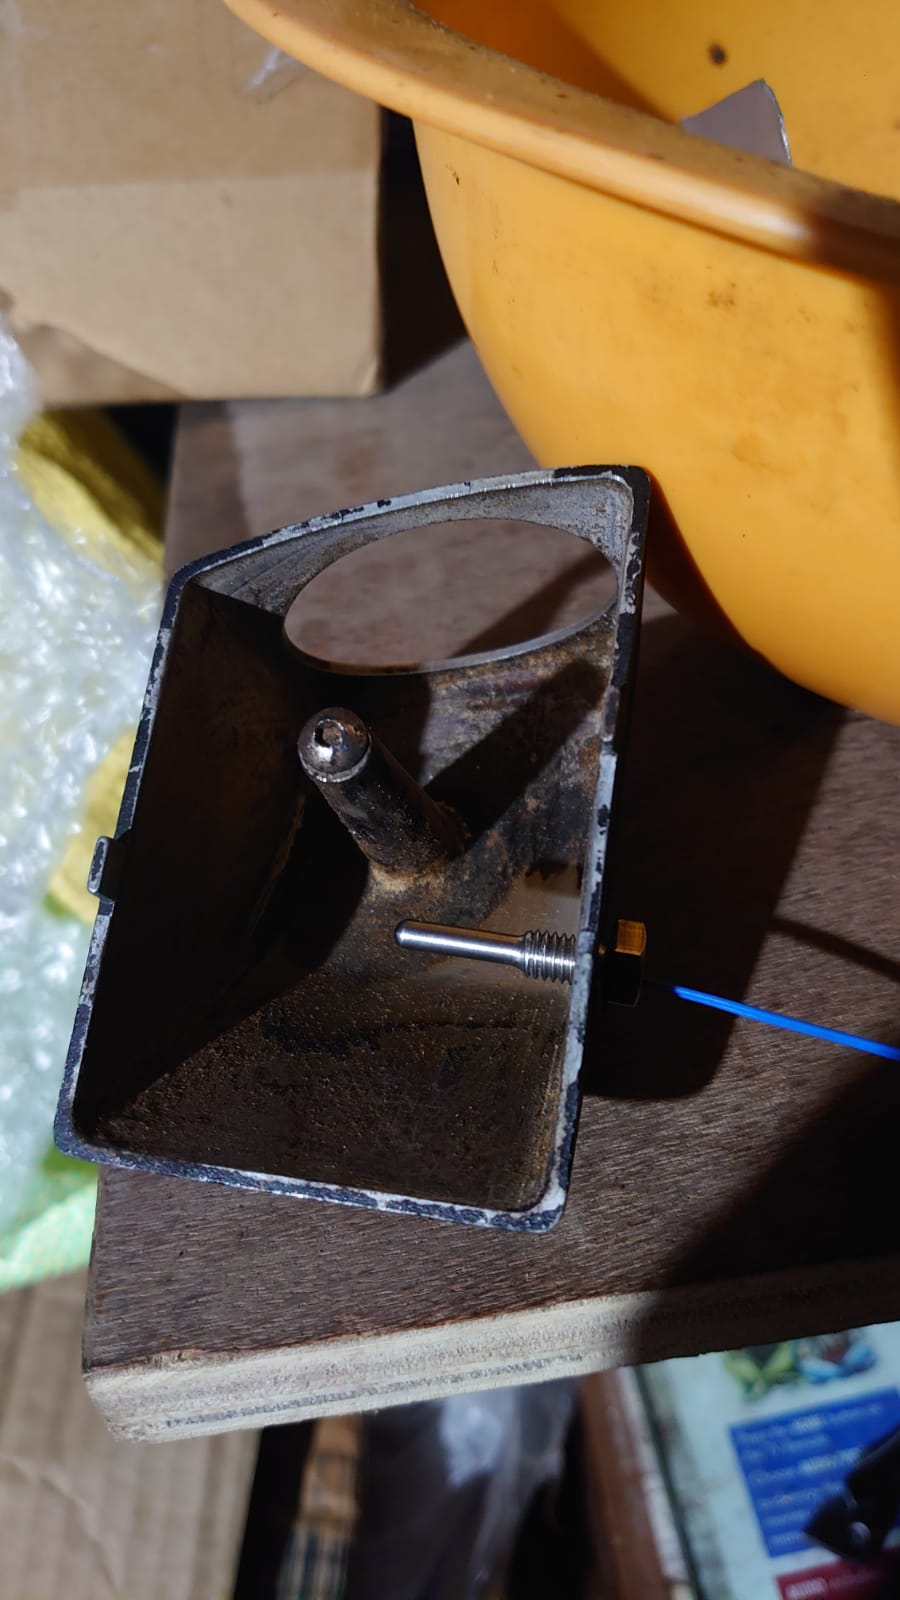
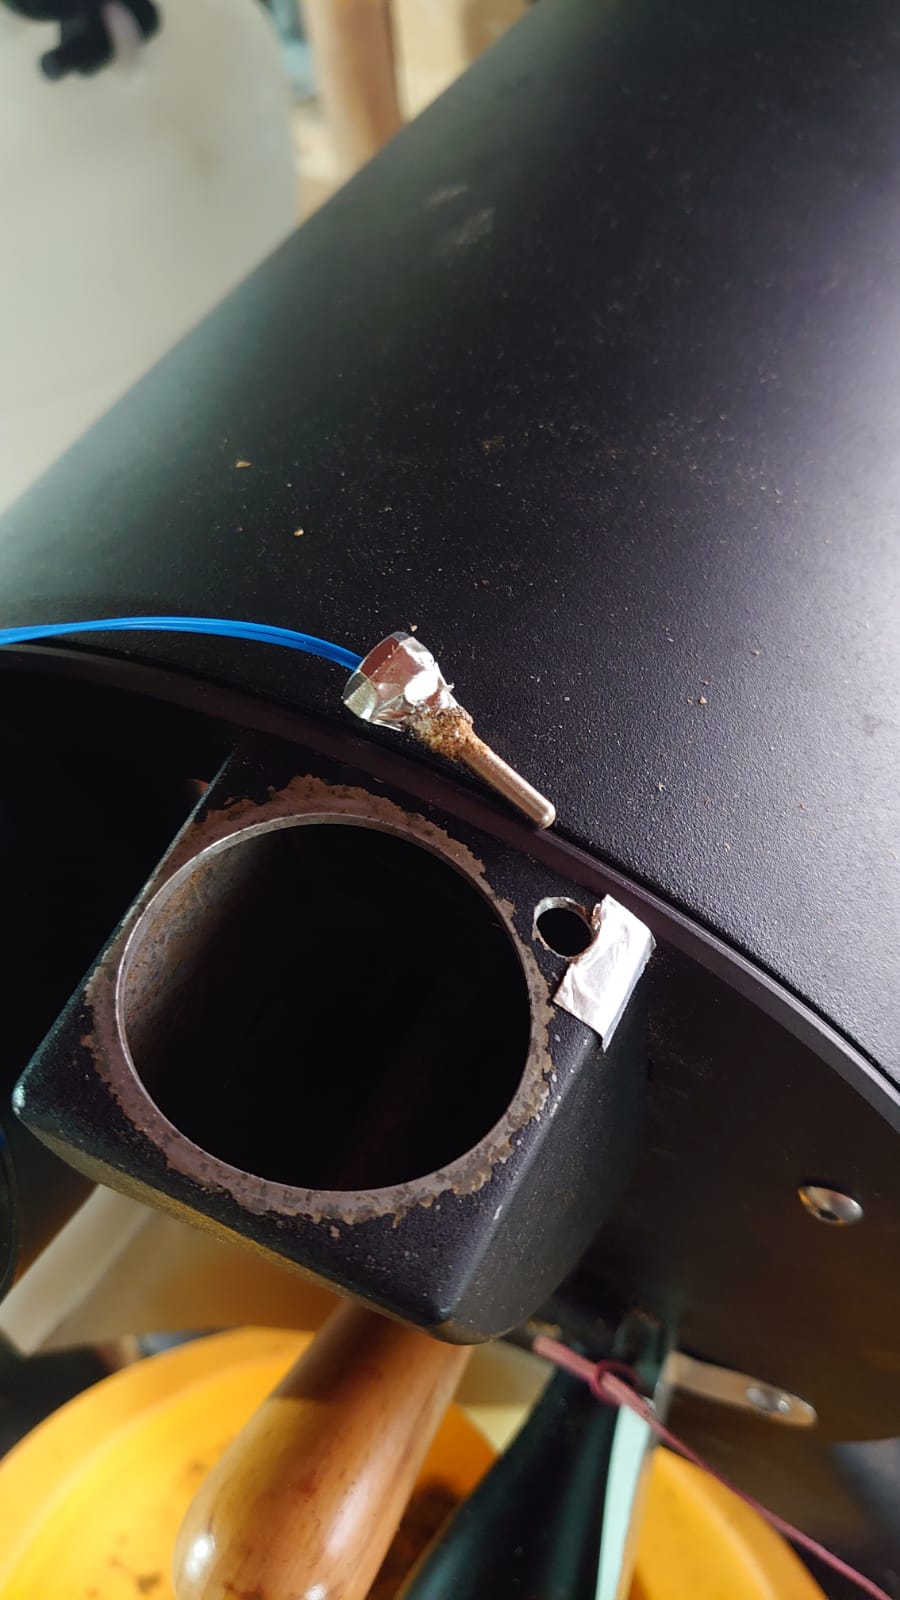
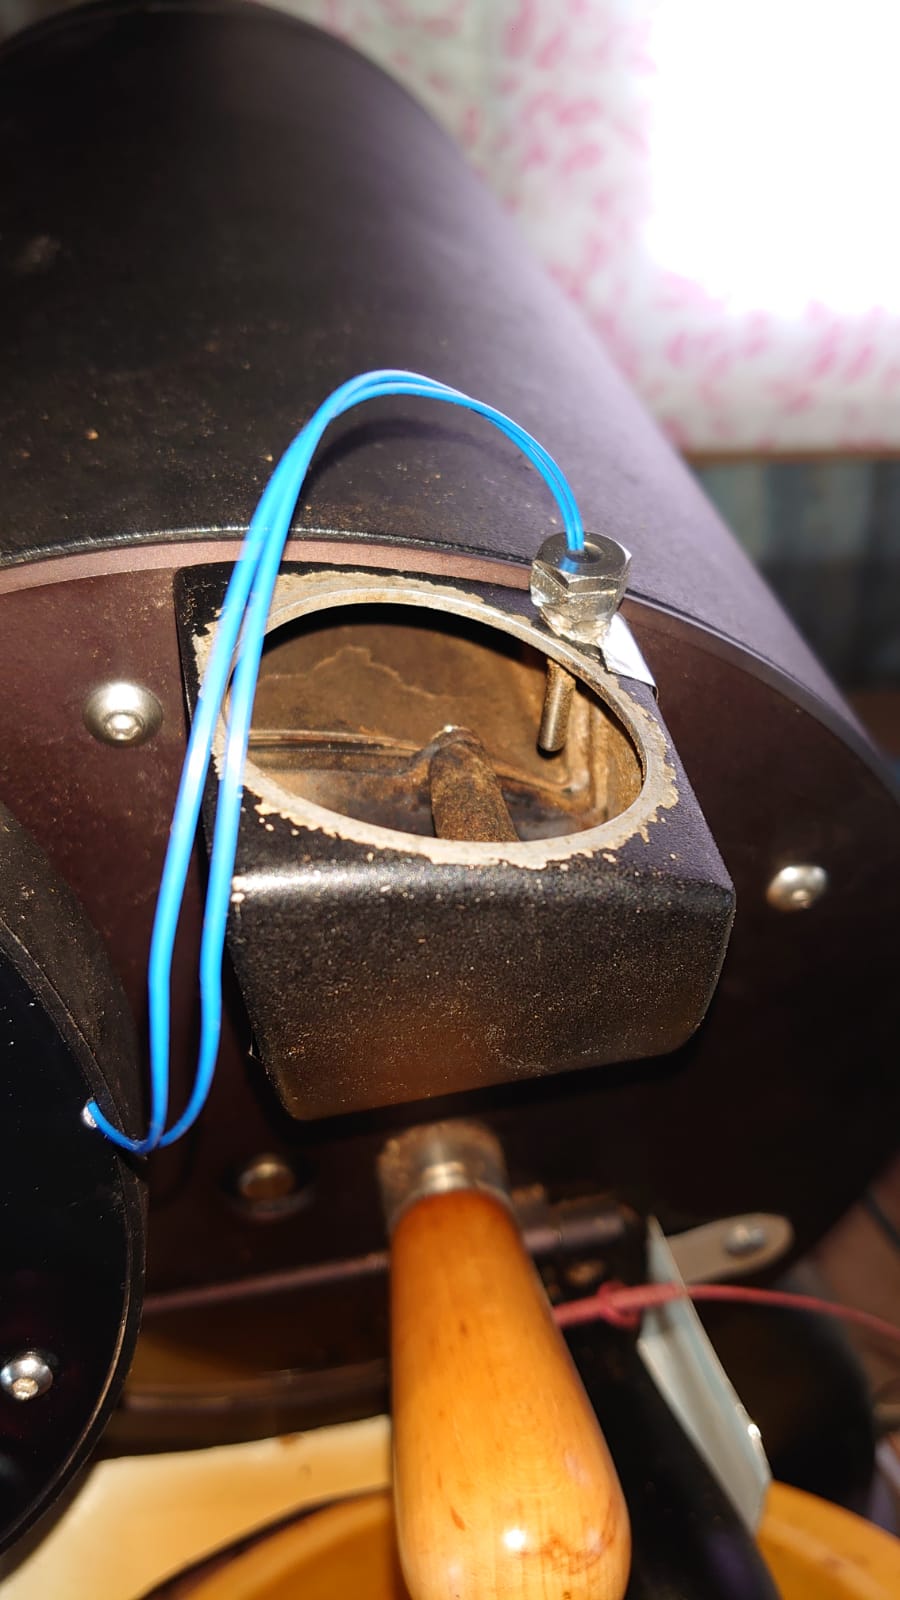
I changed the location and alignment of the probe from horizontal from the side to vertical from the top. In the earlier position the probe was directly in the way of the beans being dropped from the hopper and some also getting stuck. This one is more logical and easier to clean…
3 Likes