Hi everyone,
I wanted to share a personal passion project I’ve been working on. I built a private Windows desktop app in C# that hooks into the official Roast.World API, pulling high-resolution, 2Hz time-series curve data.
The goal isn’t to replace RoasTime or duplicate its live-catching features. Instead, this is designed as a diagnostic workspace aimed at the next layer of roasting: interpreting what happened across the whole curve, identifying upstream problems, tracking controlled recipe adjustments, and reducing blind trial-and-error.
- Hardware Baseline Note: I run my Bullet through a Tripp Lite LC1800 power conditioner. Because my line voltage is locked perfectly at 120V and free from wall sag, it eliminates a major thermal variable, which allows the predictive math in this app to be highly consistent.
- Note on Availability: This is strictly a personal, closed playground built to refine my own workflow. I am not looking to distribute, sell, or open-source the app or its code on GitHub. I am sharing it here to discuss the roasting logic framework and see how this upstream analytical approach resonates with how other data-driven roasters think about recipe development!
Main Screen: Where the Workflow Starts
The app starts on a main screen that loads my roast history via the API and displays it in a sortable, filterable grid. This is the control center of the app. From here, I can view history, search by bean, see key metrics at a glance, manage my local inventory, and launch the analysis workflow.
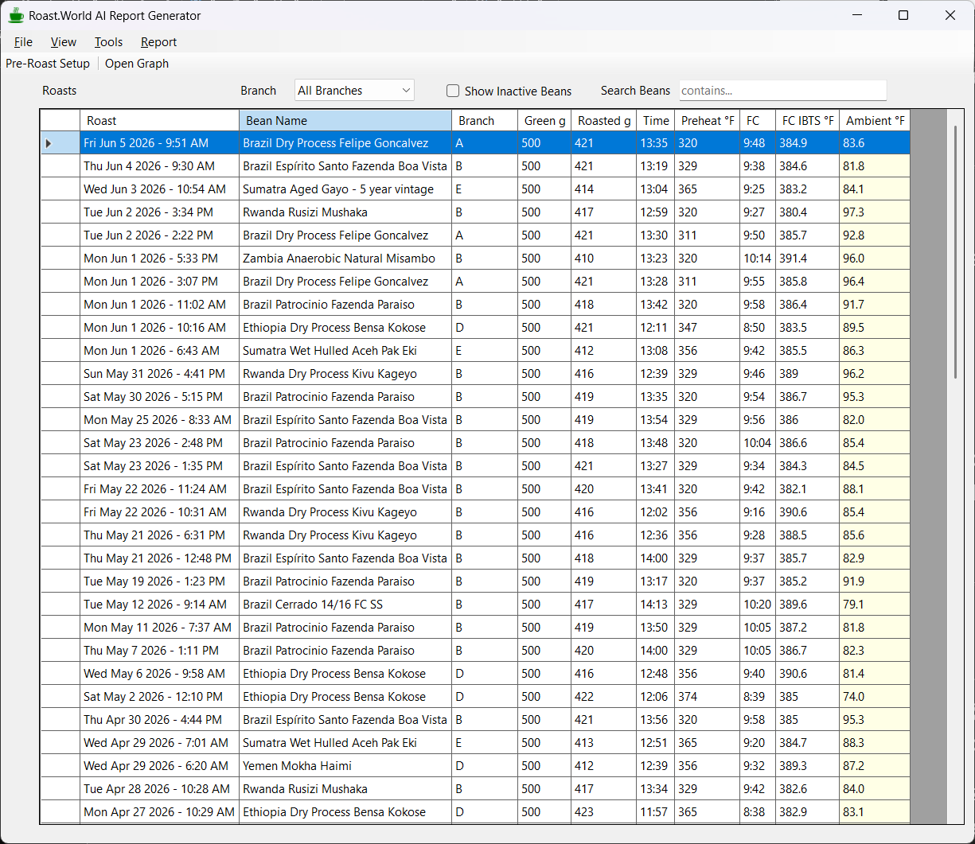
This view is critical because it gives the rest of the app its context. The graph, analysis, prior overlay, recommendation tracking, and follow-up workflow all begin by selecting a roast from this screen.
Pre-Roast Setup & Ambient Temperature Compensation
Before firing up the roaster, I can launch the Pre-Roast Setup directly from the main control grid. I select the bean and enter the current ambient room temperature. The app calculates the recommended preheat based on the bean’s baseline and current room conditions to ensure starting environmental variables stay highly consistent.
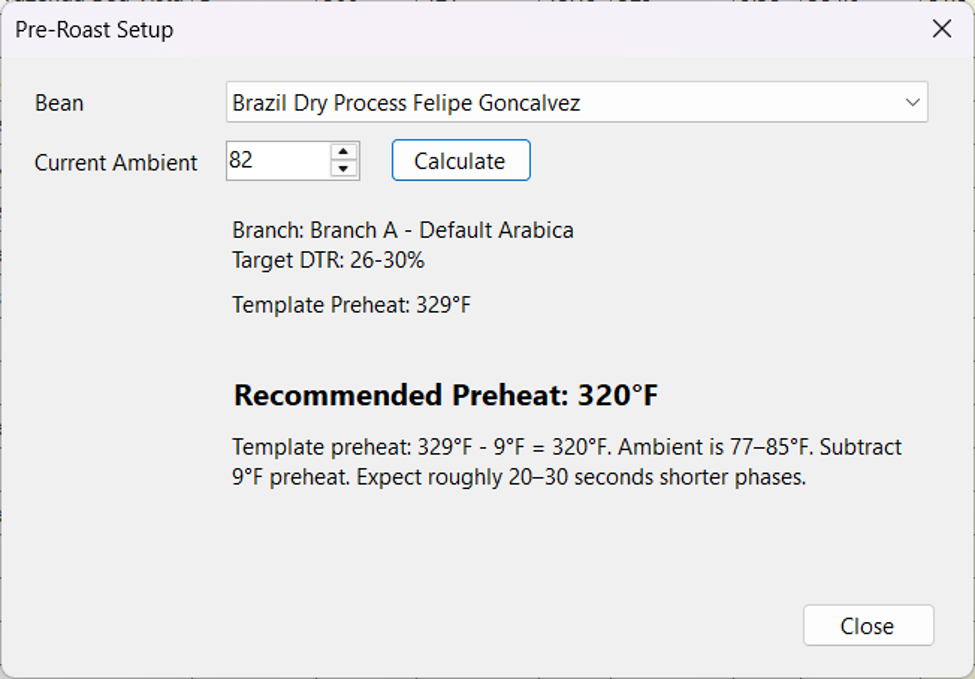
As you can see in this example for a warm roasting environment at 82°F, the app dynamically cuts the baseline preheat from 329°F down to 320°F to counteract the ambient heat. It also flags a predictive notice to expect phases to run 20 to 30 seconds faster due to the room temperature offset.
Crucially, the pre-roast setup also runs an automated backend check for pending recommendations or micro-adjustments. If the bean has a logged follow-up that hasn’t been addressed, it flags a recipe check warning before the roast starts so I don’t accidentally execute a batch without applying the intended change.
The Roast Graph as a Diagnostic Workspace
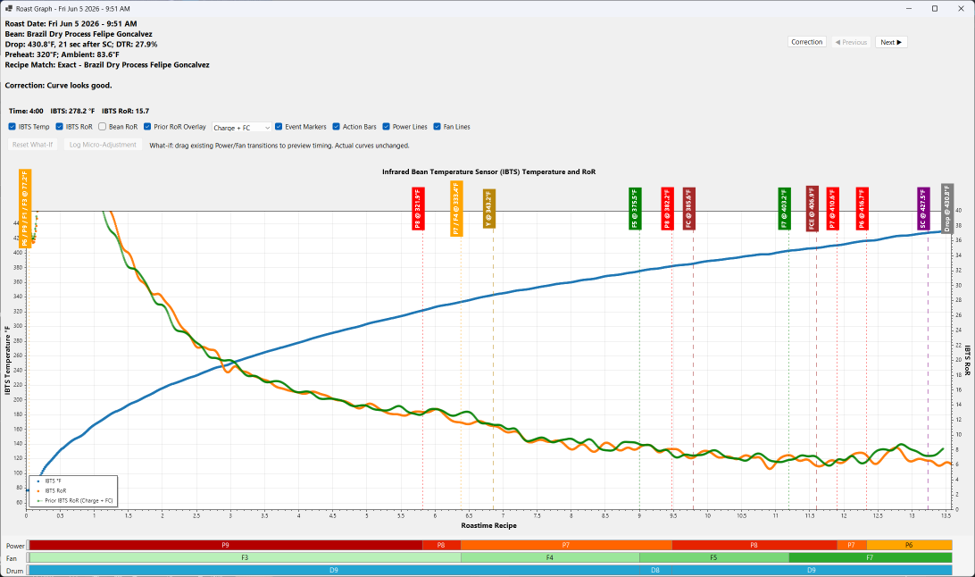
The graph view turns the stored roast data into a diagnostic workspace. It displays the IBTS curve, IBTS RoR, event markers, prior-roast overlays, and recipe action bars in one clean place for fast human interpretation.
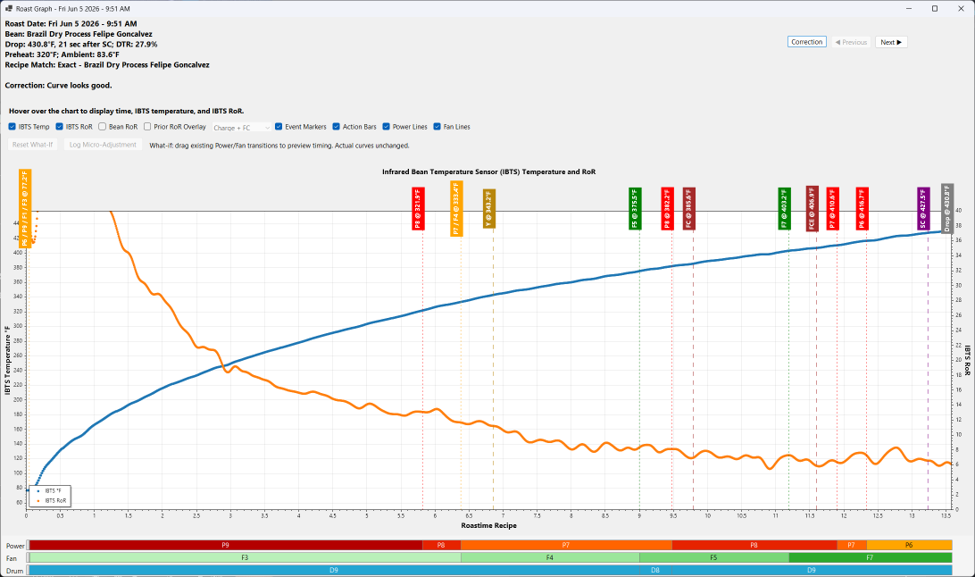
The purpose is to connect curve behavior directly with recipe decisions. For example, if the RoR drops hard around First Crack (FC), the app highlights that behavior in direct context with the nearby power and fan transitions. If the curve looks generally healthy, the app avoids recommending unnecessary changes.
Prior Roast Overlay (Blended Alignment)
The graph can overlay a prior same-bean roast to provide immediate visual context. The overlay can be aligned by charge, by first crack, or by a blended charge-plus-FC alignment.
The blended alignment is especially useful because it visually lines up both the beginning of the roast and the first crack event simultaneously. This gives a much more accurate comparison when one historical roast reached FC earlier or later than another, making it easy to see if a recipe change actually smoothed out a late flick or shifted a problem entirely.
Why Upstream Matters: FC-Transition / Endothermic Dip Logic
One of the guiding philosophies of the app is that earlier parts of the roast affect later parts. If a roast is under-supported before or during First Crack, adjusting a late-development fan step treats a symptom while leaving the root cause untouched.
To handle this, the app uses a proprietary rolling-window algorithm analyzing the 2Hz data to detect significant endothermic dips around FC. Crucially, the app dynamically adjusts its sensitivity based on the bean’s assigned branch/profile family. It knows that a dense, washed African bean behaves differently through FC than a soft, natural South American bean, preventing false positives.
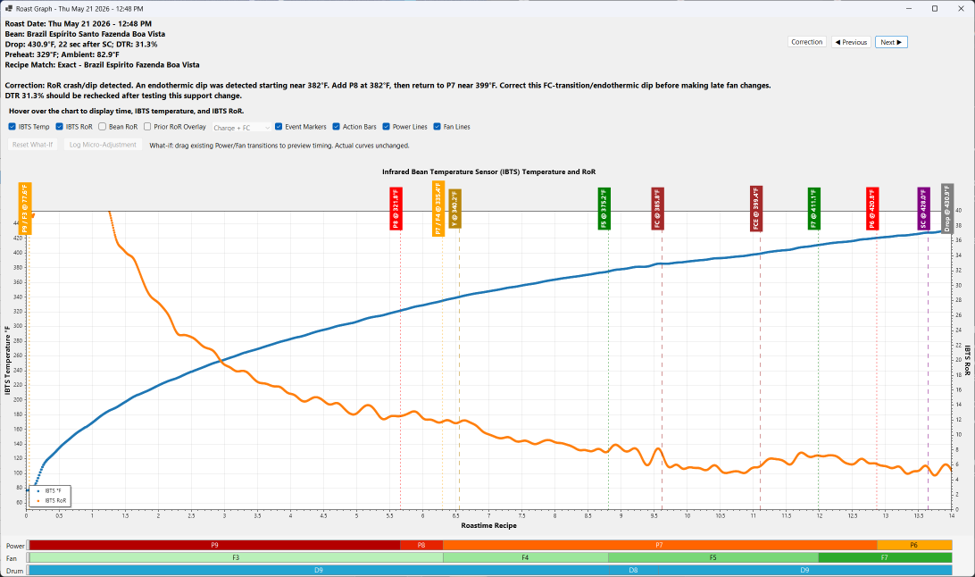
When a material dip is detected, the app prioritizes correcting this upstream energy-support problem before it ever looks at late-development behavior. It will explicitly recommend moving a power step earlier or increasing support through the transition so the development phase gets a clean, well-momentumized starting point.
Controlled Recommendations & Recipe Correction Details
To keep recipe development disciplined, the app is intentionally conservative. It avoids throwing a massive pile of changes at you all at once. It prioritizes the single most meaningful adjustment to test on the next roast, keeping iterations controlled.
When a recommendation is triggered, the correction details view breaks down exactly what happened, the exact timestamps and temperatures of the curve shift, and the logical rationale for the fix.
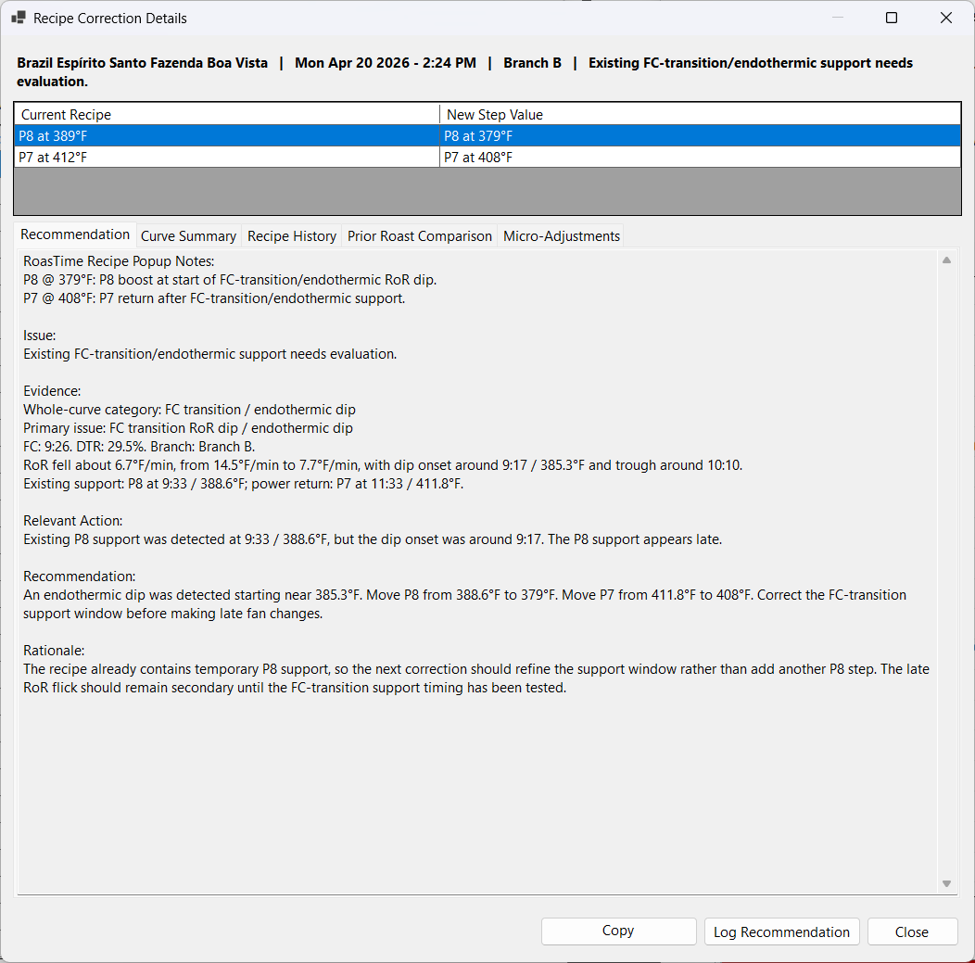
As you can see in this example for a Brazil Espírito Santo, the app detected an onset dip at 9:17 but noticed the existing P8 support arrived too late at 9:33. Instead of telling me to change fan settings or add random new steps, it explicitly calculates a tighter window to refine the existing support upstream.
Note the secondary tabs in the form (Curve Summary, Recipe History, Prior Roast Comparison, and Micro-Adjustments). These allow me to instantly toggle between the automated logic text, the visual overlay graphs, and the longitudinal history of that bean’s recipe family without ever leaving the diagnostic workspace.
Logged Recommendations and Follow-Up Roasts
Because we often don’t roast the same bean again for days or weeks, it is incredibly easy to forget a planned experiment. The app lets you log a recommendation as a pending follow-up item.
When a later same-bean roast is opened, a pre-roast check warns you if a recommendation hasn’t been applied yet. Once the roast is complete, the app prompts you to evaluate the result as: Improved, No Material Change, Worse, or Inconclusive. This completes the loop, tracking whether the recipe change actually worked.
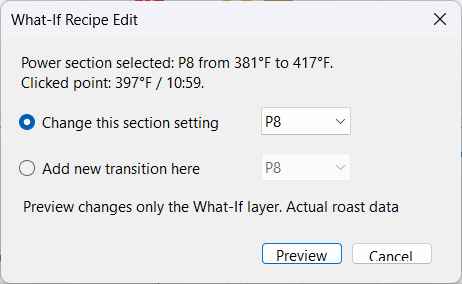
What-If Projection Engine
For planning, the app includes a “What-If” feature. On the graph, I can drag an existing power or fan transition to a different IBTS point, and the app displays a projected RoR overlay based on how similar transitions behaved in prior roasts.
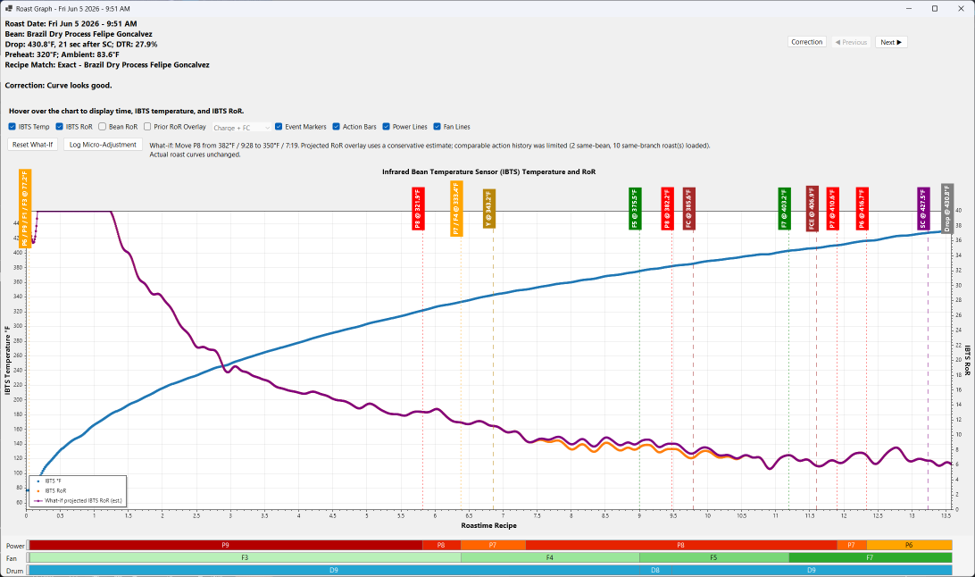
This is not meant to be a flawless thermal model, but because my line voltage is perfectly conditioned, it provides a highly accurate baseline for reducing blind trial-and-error. It lets me visually test ideas like, “What if P8 started 20 seconds earlier?” or “What if the fan step moved closer to the start of this RoR rise?” before firing up the drum.
Micro-Adjustments
Not every change needs to be a formal recipe overhaul. For tiny wiggles or minor refinements that don’t affect cup quality but are worth smoothing out, the app supports a lightweight “Micro-Adjustment” tracking tab. This keeps minor experiments separate from the main analyzer logic, letting me track small refinements when I want to, without cluttering the core recipe history.
The Real-World Proof: Nailing the Elusive Vienna Roast
Many high-data hobbyists focus exclusively on light or medium roasts, often avoiding darker profiles like Vienna because they are incredibly tricky. It is a razor-thin line; extend the development phase by just a few seconds too long, and you end up with an ashy, bitter cup.
I use this app to manage roughly 20 batches (500g each) a month. I don’t sell a single gram of it—instead, I give it all away to a closed group within my church community. Out of about 600 members, a dedicated core of dark-roast lovers relies on me for their beans. Before building this C# loop, hitting a perfectly sweet, complex Vienna roast without the heavy ash notes was a guessing game.
Now, the discipline enforced by the app’s tracking and upstream corrections has made my roasts incredibly consistent. The real validation hasn’t just been a pretty graph—it’s been the feedback from these community members who tell me, “I can’t find coffee this good anywhere else.” It proves that even for demanding dark profiles, clean data structure leads directly to a better cup.
Summary of the Workflow
Ultimately, the app is built to enforce discipline and keep the chain entirely connected:
Roast Curve ➔ Issue Detected ➔ Recommendation Made ➔ Change Applied ➔ Follow-up Roast ➔ Evaluation.
I’m really enjoying how it has streamlined my data interpretation. I’d love to hear your thoughts on the core logic—especially the concept of automating upstream priority corrections over downstream symptoms, and how you approach tracking recipe continuity over time!
A quick note on replies: I’m currently completely buried in a busy season of roasting for my church community and working on other coding projects, so I won’t be able to reply to comments or check this thread often. I just wanted to share the framework and logic with the community. Happy roasting, everyone!