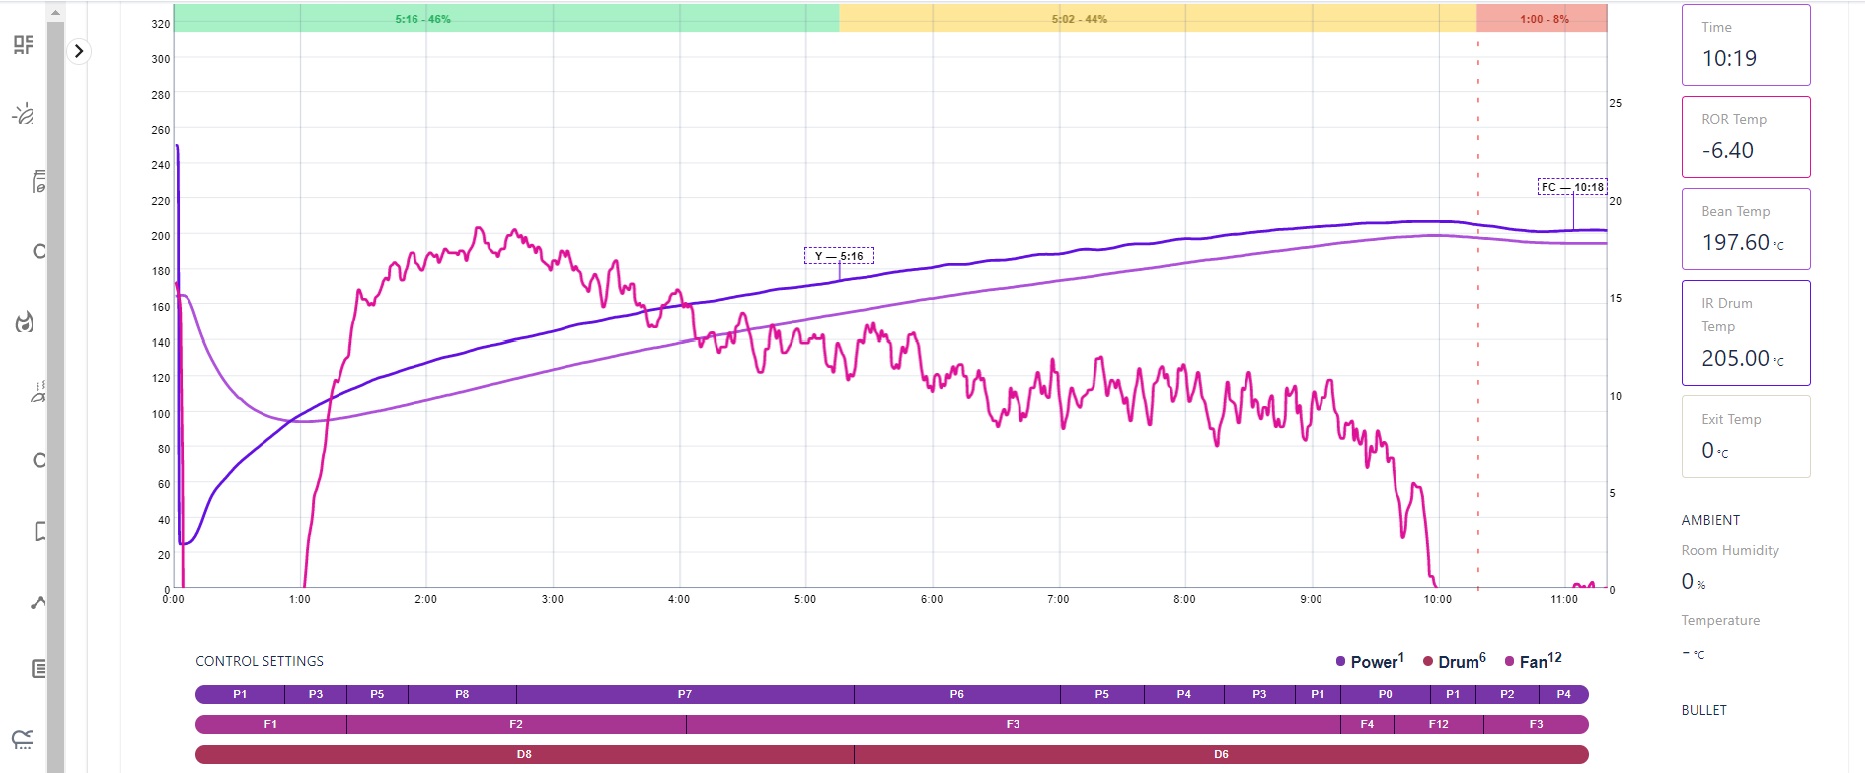
I’m not sure if its just me, but it seems that roast.world has been updated recently, and there is more info being displayed in the graphs. However, what I’m finding is that the data (power, fan, drum speed) doesn’t line up with the above graph. I’ve attached a screenshot of what I’m seeing.
Do other people see this? Its just difficult when looking at my graphs (or other peoples) to figure out when changes were made etc.
It works perfectly for me. Could you try a hard refresh (CTRL+F5 on windows | CMD+Shift+R on mac) but check if it works in your browser. Otherwise please try logging out and back in.
I’ve tried logging out and logging in again, and tried a different browser. Both give me a similar view, i.e. misaligned data from the bottom to the top of the graph
I looked at your profiles and they work in both firefox and chrome. Can you try going to full screen and or dragging the size of the window sideways?
Left if firefox, right is chrome. What browsers did you try?
Thank you for pointing out this issue. I’m working on getting it fixed ASAP.
In regards to your question about this being caused by the Feature Preview option, I would like to say that it’s not caused by this as the only features affected by the feature preview option is listed one the features previews page.
This particular error seems to be caused by changes to the graph width/height during the page load (or when the sidebar is minimized/maximized). The chart doesn’t pick up the changes and thus doesn’t always repaint
When in the Feature Preview the graphs are still misaligned. I use Safari on a Mac. I opened Chrome browser, logged in and checked the graph in Feature Preview Roast World and it is still misaligned.
This isn’t a big deal as I can alway look at old Roast World and when I want a screen capture or study a profile I generally use RoasTime to see BT and IBTS ROR curves.
Also, I have noticed sometimes FC mark is missing and other time the FC mark is there. Here is another sample. The FC mark showed but not in line with the development ratio on the top as well as the Control Setting on the bottom.
Thanks for getting back quickly about this. Can you let me know which browser you are using?
Also, in regards to the control settings changes and the missing FC milestones, these were fixed today. Can you let me know if you’re still experiencing this?
Great work ! I have looked up again on my roast world and the missing FC mark symptom has been fixed ! But the control setting is still not in line with the chart.
I am using chorme as my main browser and once in awhile “edge”.
Thanks for the quick fix on the FC milestone mark!
More input about this is, it looks perfectly OK when you first get in and select one of the roast you want to look at. Everything looks fine.
But if you decide to hide the menu on the left side of the roast world. the chart will try to expand, or the other way around if you decide to see the menu of the left hand side the chart will try to adjust to a smaller size. That is when the control setting not in line with the chart.
Hope that helps!
Hey @fred0823, thanks for the heads up on what exactly was causing the issue. I’ve managed to figure out what the cause of it was (it was caused by the sidebar’s animation).
I’ve published a fix for this on RW. So you can reload RW and this should be working then.
@derrxb I just wanted to check… is one of the changes on RW is to now have a fixed x-axis scale (15 mins) and the graph will dynamically change based on the width of the browser window? I’m just checking because a it looks a little scrunched up if my browser window isn’t full screen (I have a 24" LCD).
The recent change was to have the RT and RW graphs behave the same way by using the configured xAxis and yAxis values you can set in RT.
However, when I had originally made this change, I made a typo on the hard minimum distance for the graph and it was set to 15 mins. This was quickly fixed though and it should be working. If it’s not, can you try reloading RW or checking if your xAxisDefault in RT is not set to 15 mins?
Let me know how this goes and if it doesn’t work, I can look some more into it.
(Sorry, used the wrong account to comment. This is @derrxb)