Hi everyone, is this graph normal? why is my graph like this? is this normal? how to make smooth ror?
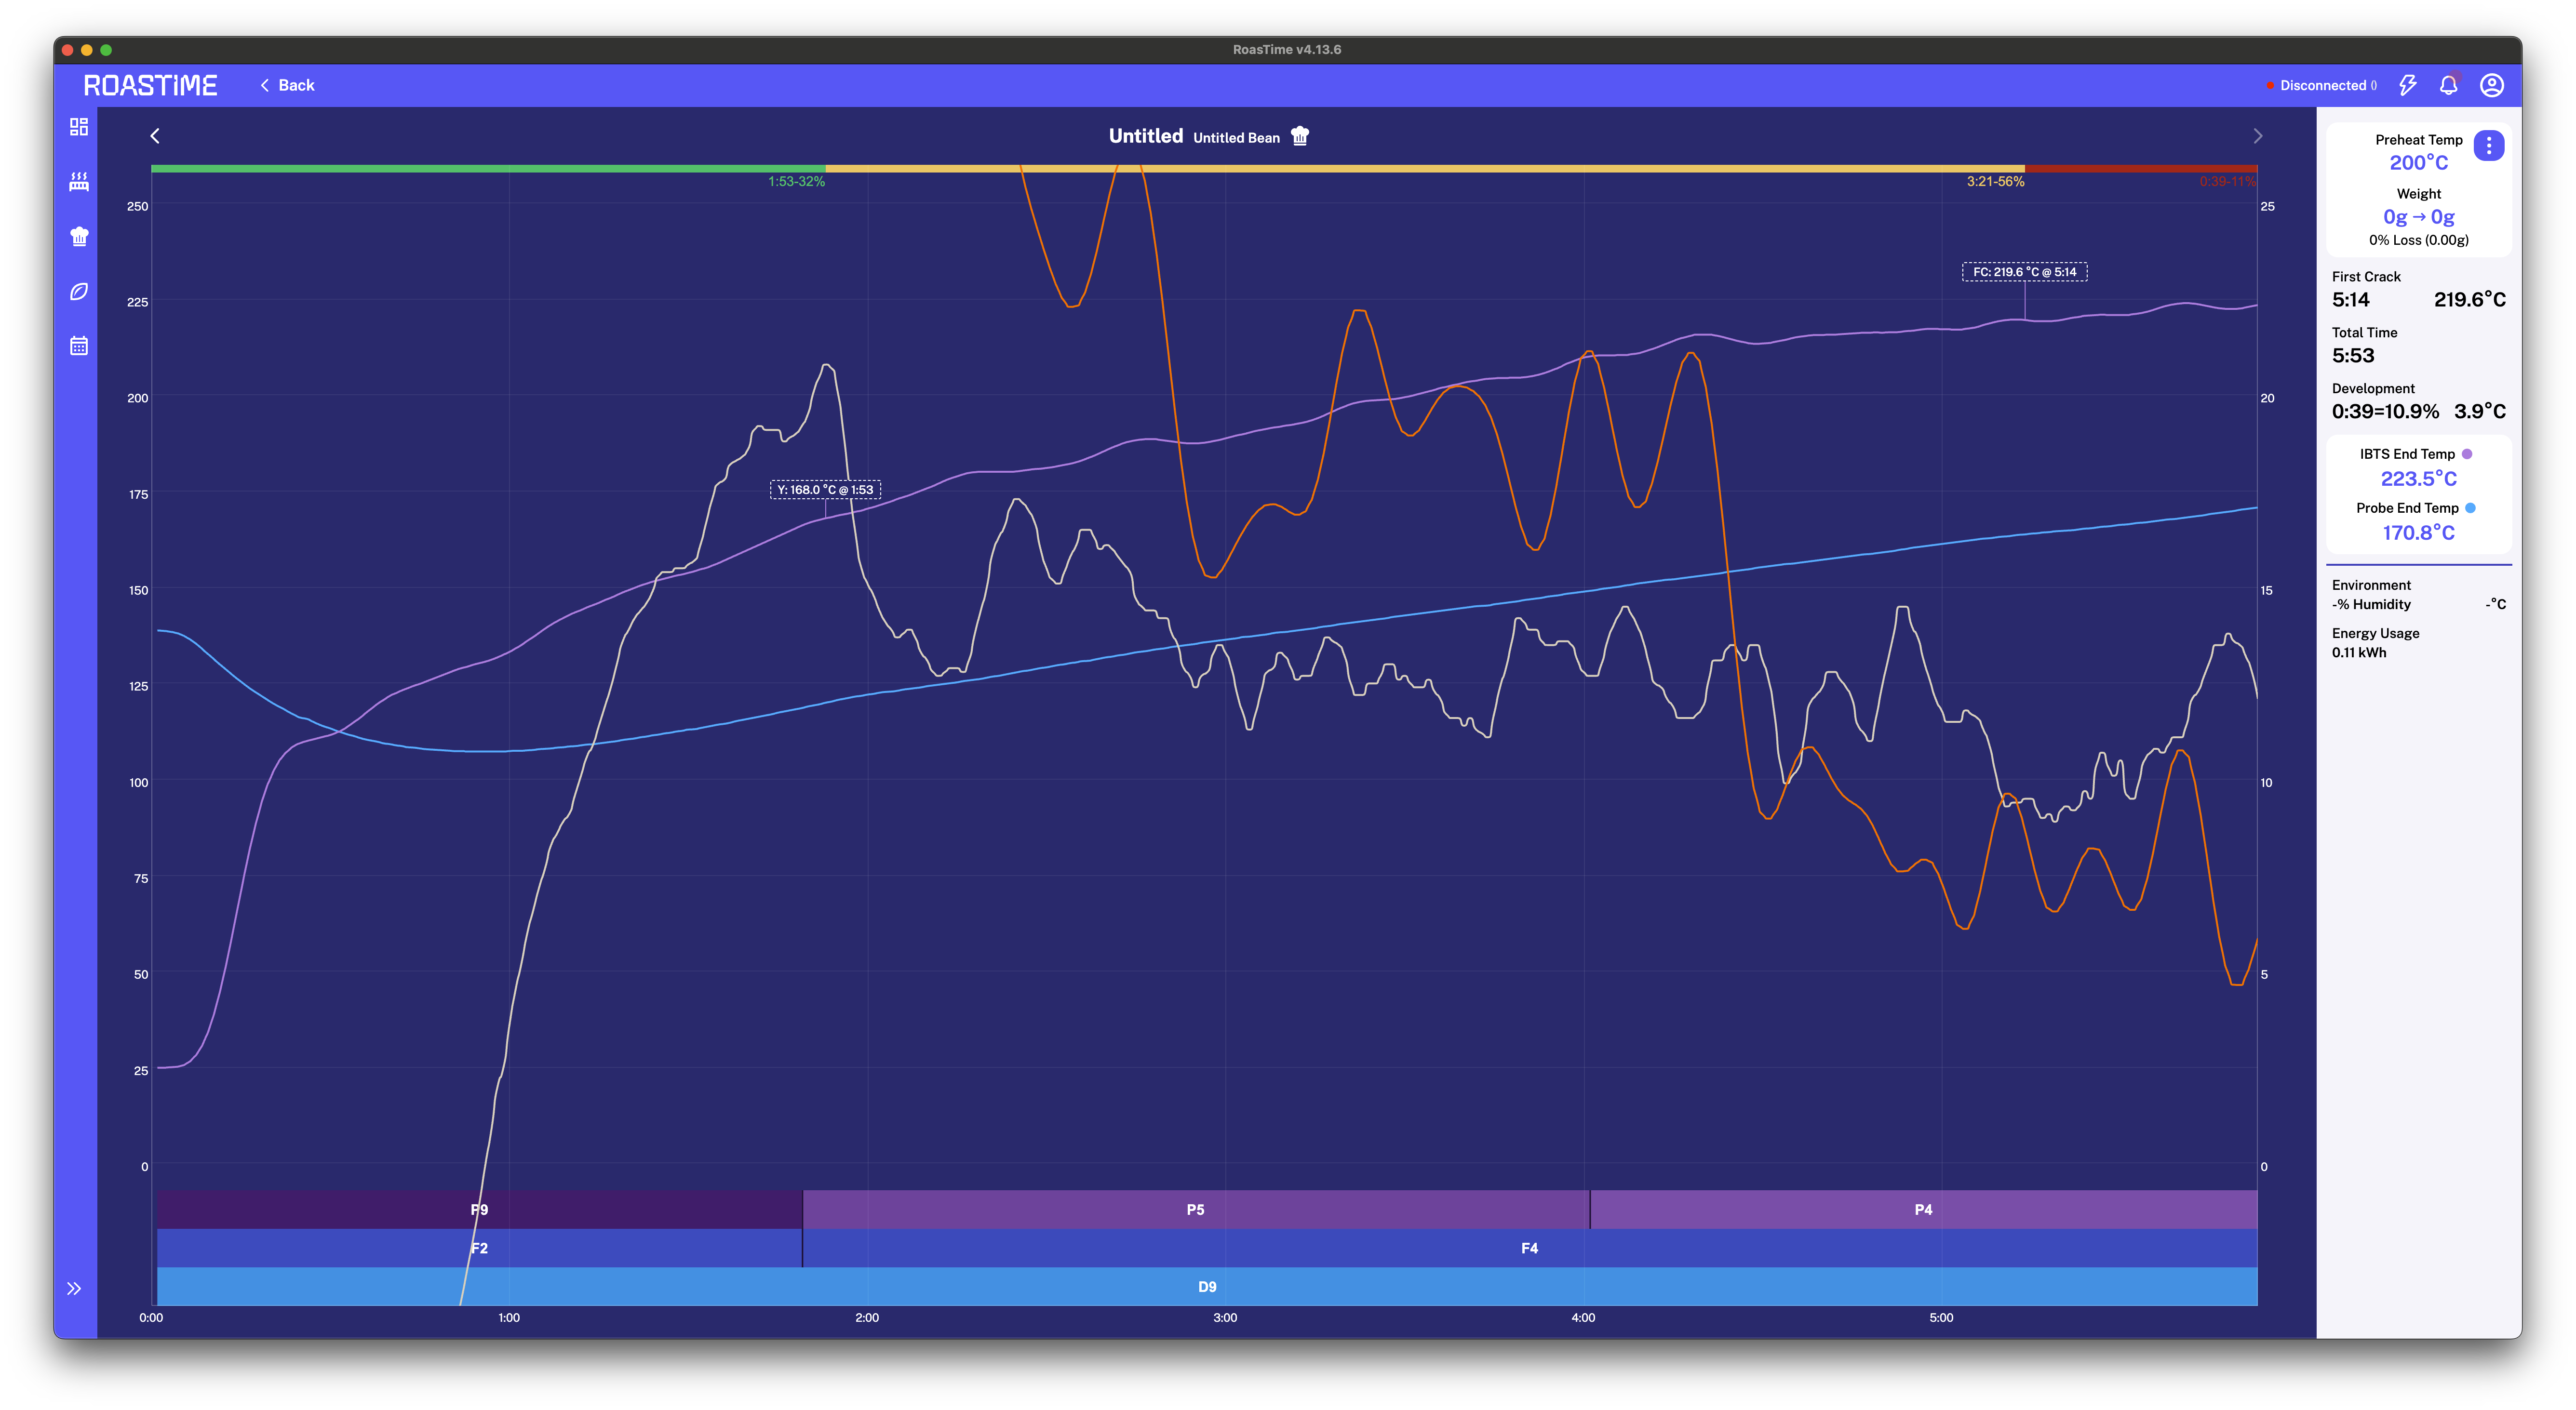
Your posted roast data doesn’t include a batch size. But, based on the large gap between the IBTS temperature curve and the bean probe temperature curve, as well as the crazy-short dry time, I would guess it’s a smaller batch – less than 500g, maybe 200 grams?
Smaller batches produce more volatile sensor readings, and if you’re roasting sample-batch sized loads, you can expect this to be pretty typical.
Might want to check out this article: (Very) Small-Batch Roasting on the Bullet w/ Rob Hoos - aillio
1 Like
Oh yes, you’re right, it’s a small capacity of around 150-200g. I used Rob Hoos’ recipe, but I’ve adjusted it to suit the characteristics of the coffee beans I often process.
OK, sounds like what you’re seeing is not at all unexpected then. Small batches can be very noisy, especially the IBTS temp, and therefore, the IBTS ROR.
Roasting small samples like that, I’ve usually tried to rely more on time and color, but I’ve only done it a handful of times, so good luck to you!
1 Like
I also see lots of noise on the ROR even at full capacity. I’d be really interested to hear if anyone has any ideas for this too… Even the thermocouple ROR is a fair amount jumpier than I would expect.
Here’s a an example from my last batch. No judgement on how dark this roast was plz haha…
This topic was automatically closed 90 days after the last reply. New replies are no longer allowed.