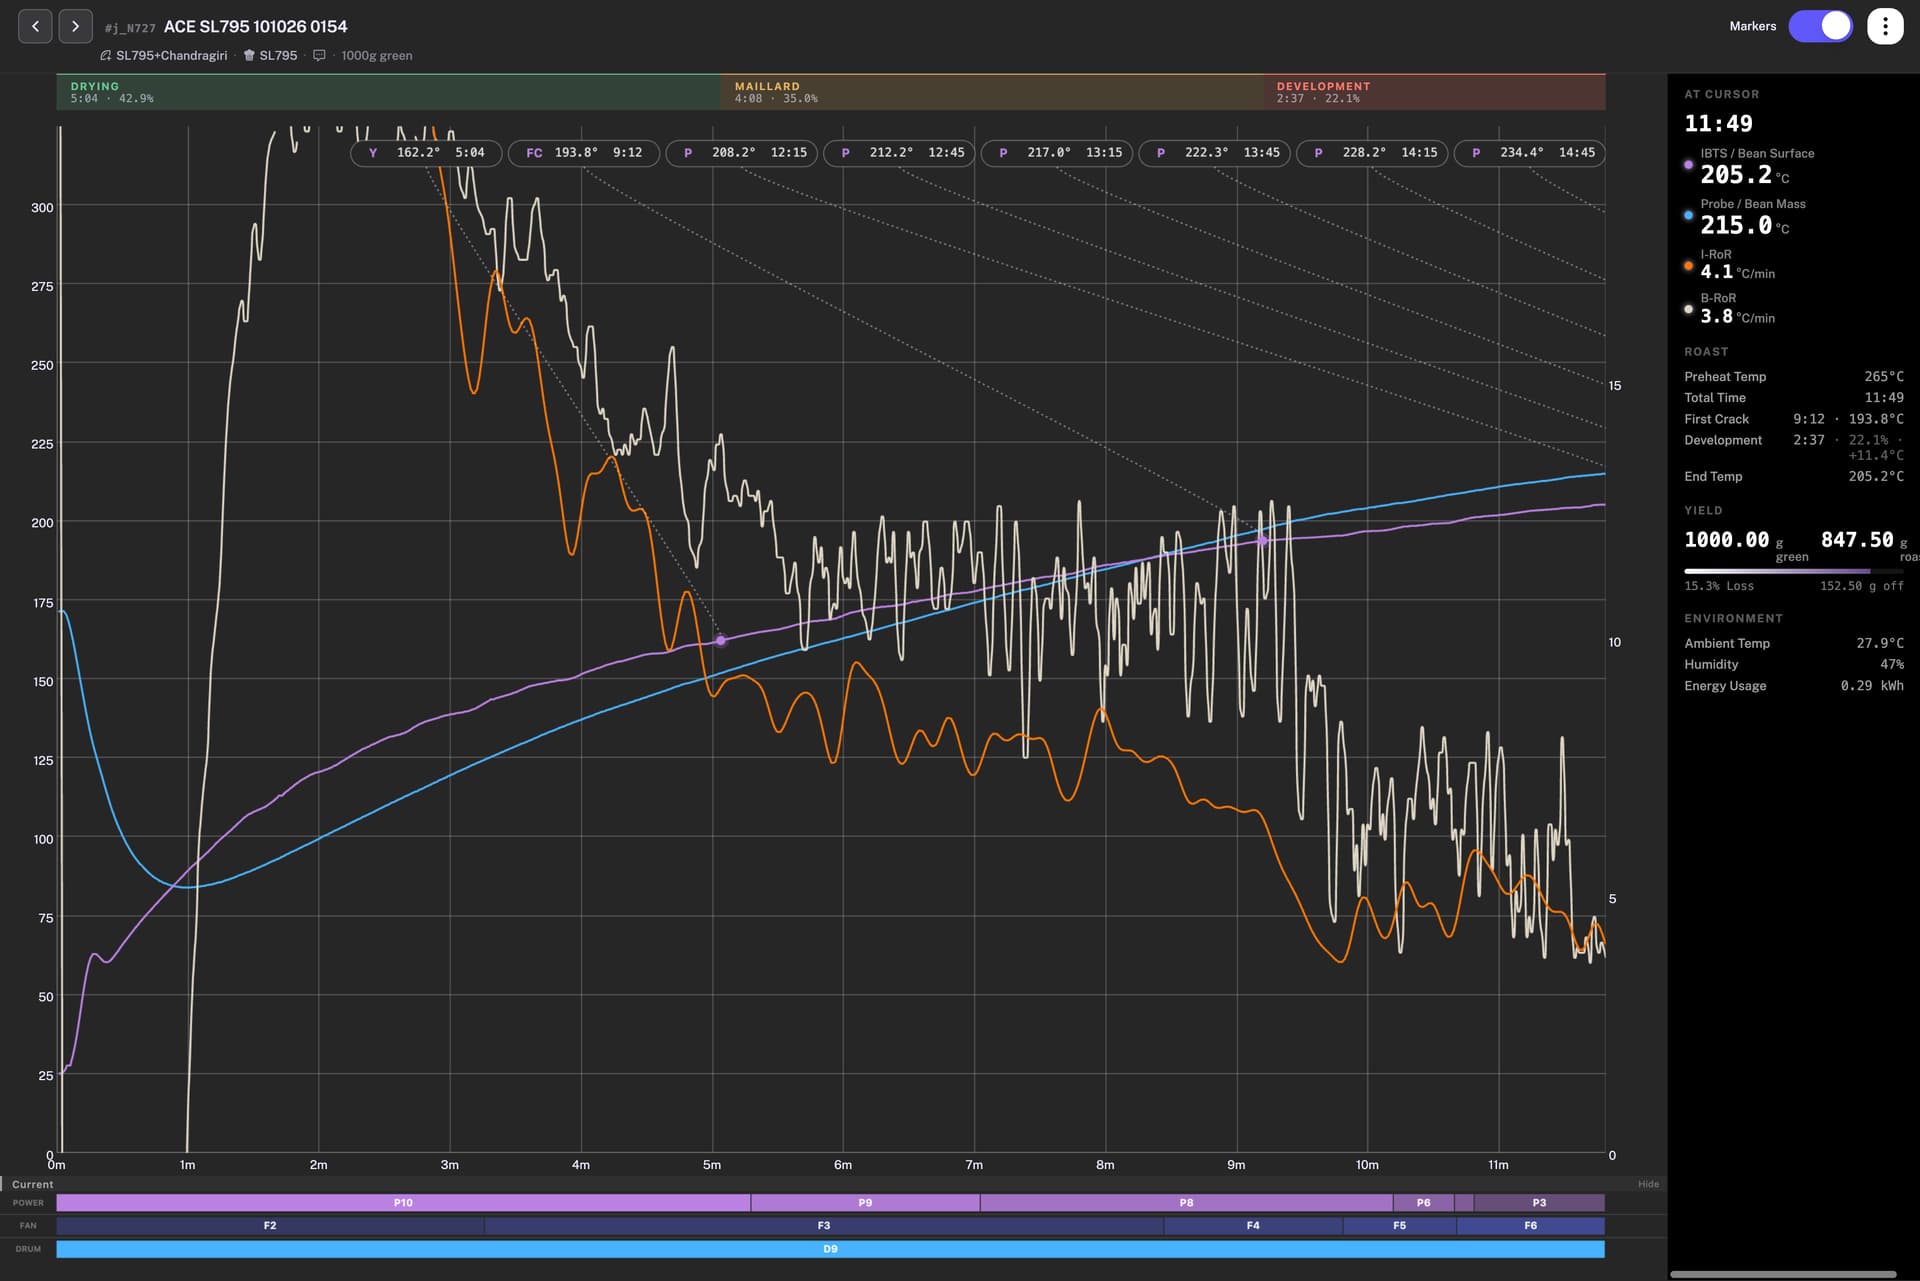
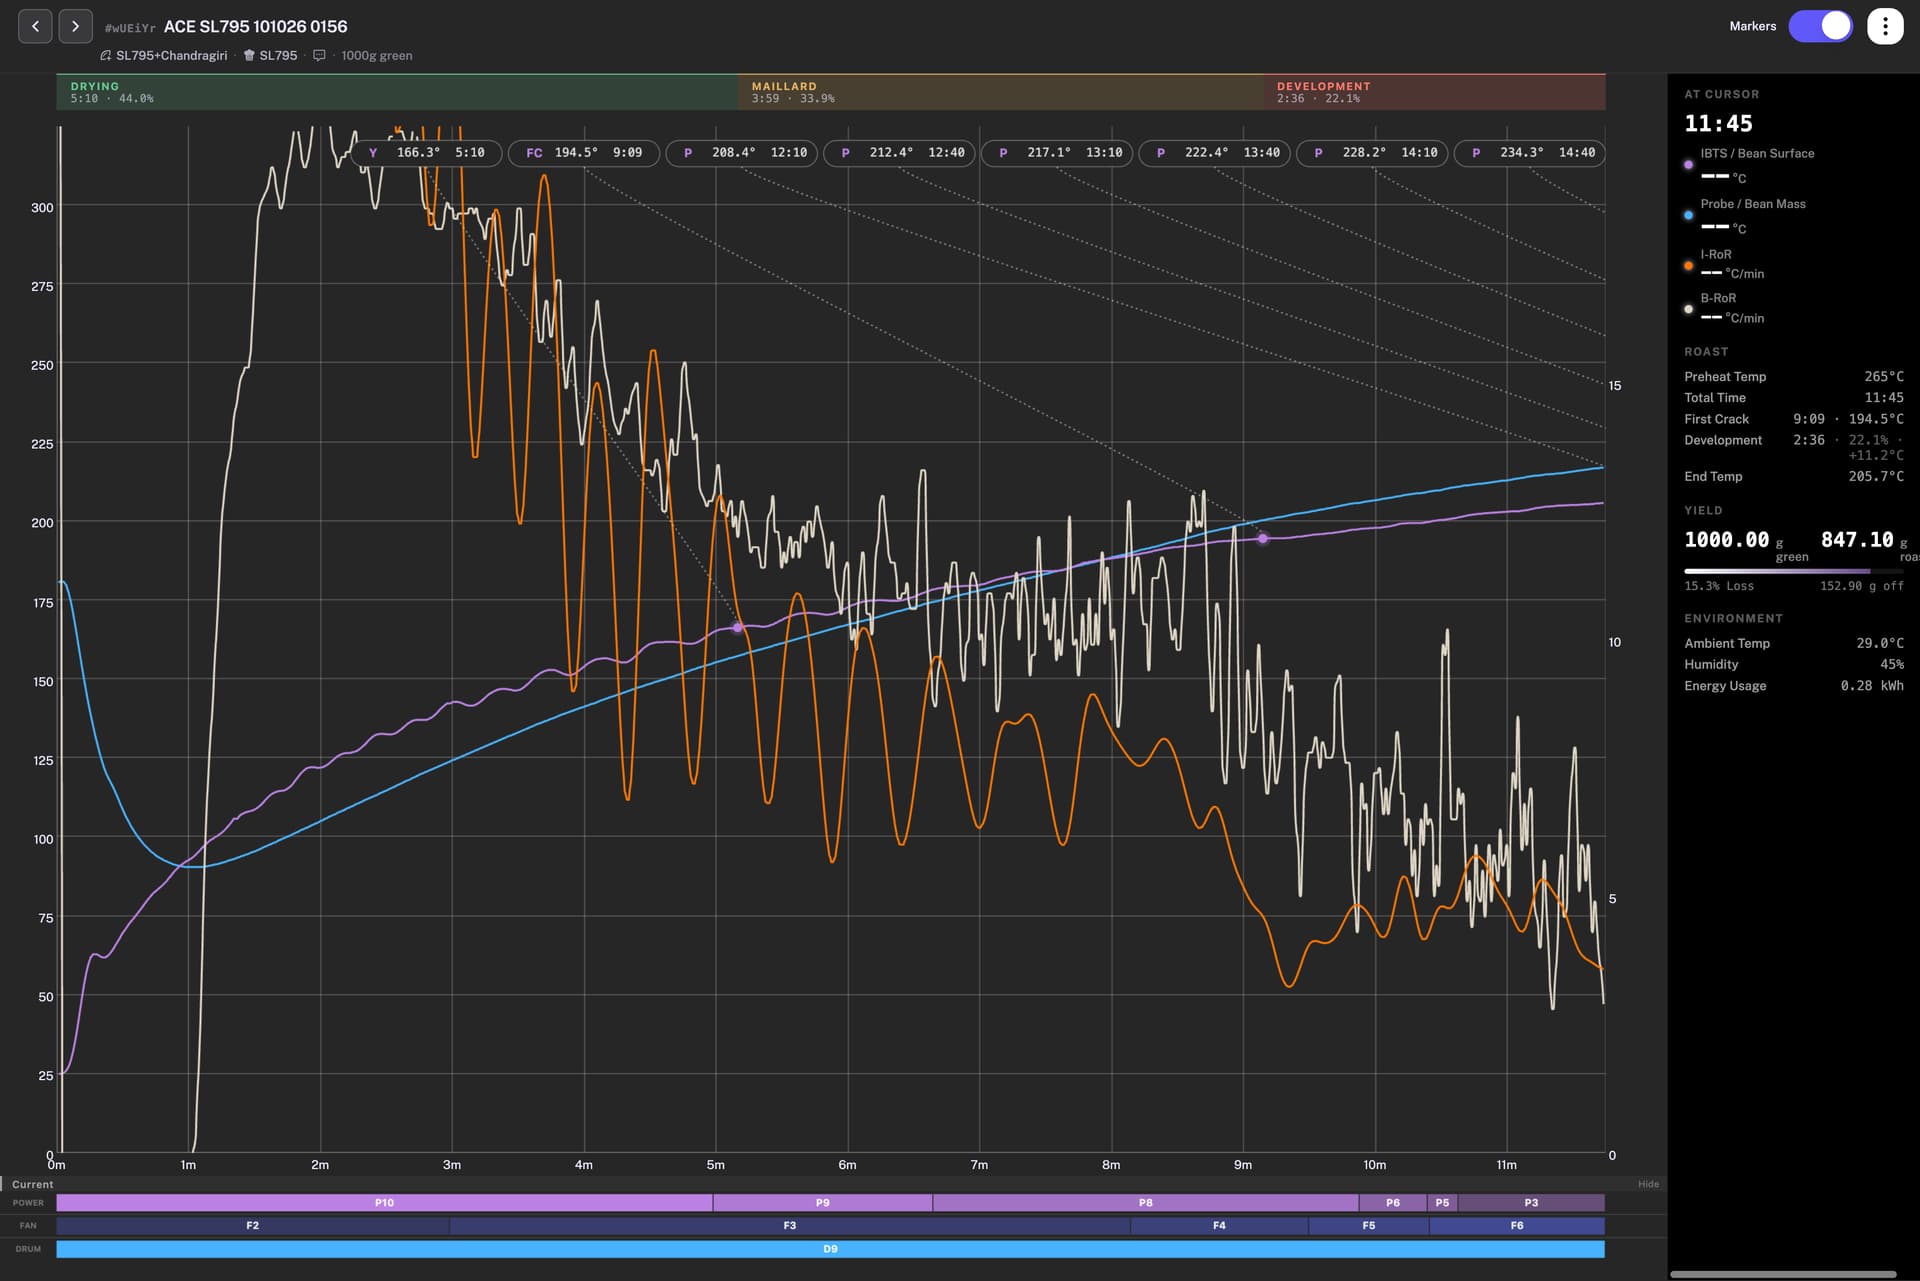
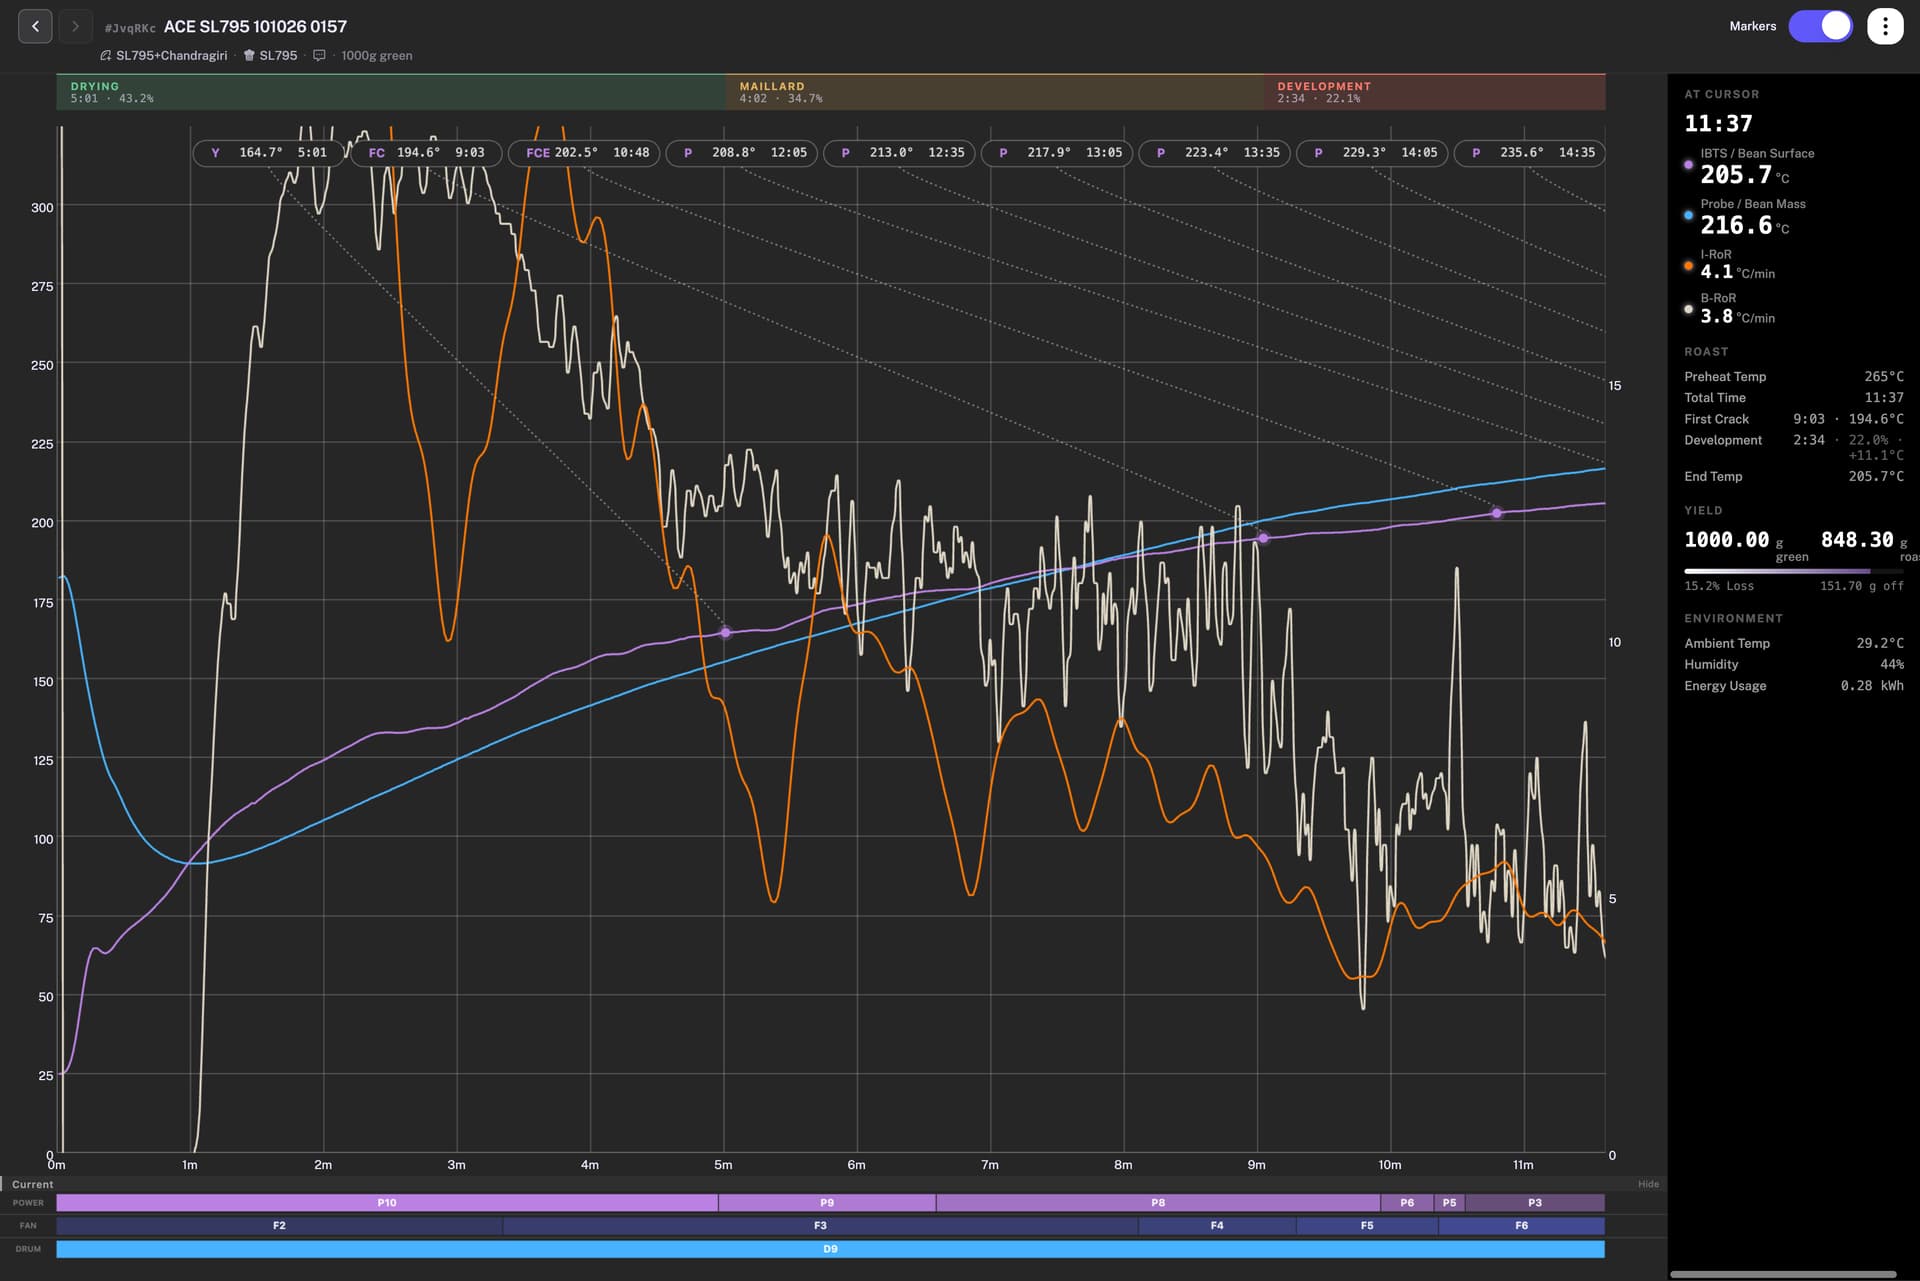
i have been having ths issue since i started doing back to back roasts.
a syou can see in the graphs attached. the roast time and quality seems to be the same but, the profile curves go mental as i continue the back to back roasts. Also all my curves seem very noisy to me… is this normal?
I see your charge weight is 1kg – could be a stuck bean. They can get wedged against the BT probe. When’s the last time you cleaned the IBTS sensor? Once again, with full capacity load could be dust or even a bean jammed up in there somewhere.
One observation, all three batches hit first crack between 9:03 and 9:12, ended at 205 to 206 IBTS, and lost 15.2 to 15.3%. That is about as consistent as back-to-back 1kg batches get, so I would trust those over the RoR lines.
The IBTS and probe lines themselves look smooth in all three. The noise lives in the two RoR lines, and RoR is a rate of change, so it magnifies tiny wobbles in the reading. The orange I-RoR swings do grow, so something is shifting, but my hunch is it is the readout more than the roast, possibly a firmware quirk in how the Bullet is sampling or smoothing that channel rather than anything happening in the drum. The cup is the real test, if all three taste the same side by side, I would investigate the firmware and sensor hardware.
No. The jumps from the IBTS curve are reflected on the RoR curve. It’s just that you see them differently because they are measured differently.
This is the R2 and I’m not sure what other differences there might be other than IBTS calibration.
That being said, let me link my other post as I did find the swings can get wild when the appropriate amount of heat is absent. Barring any huge differences between R2 and R1, the 265°C PH seems a bit low for 1KG, and that’s why the graphs oscillate.
Thanks. yes thats how i would look at it too.
but what i dont understand is that why does the graph within a few minutes of each become progressively mental? same roast same recipe same environmental conditions
thanks, so effectively if i were to increase my charge temperature for the 1 kg roast… i should see a more consistent and controlled roast/behaviour? but again why does it get progressively get bad with each following roast? it should be crazy for all of them.
No, you should see a nicer graph. If you are satisfied with your coffee and some line that someone said should be straighter is convincing you otherwise, don’t listen. You’ve asked about graphs, and I’m just telling you why they behave like that.
Any number of reasons. Dirty sensor, roasting in a drafty environment, trier, plug or the other plug on the chaff collector letting air through, too much chaff accumulated from previous roasts in the chaff collector… The R2 should have the airflow control, but I don’t know if it’s just a warning light or you can pull some data off of it. It could also be the beans themselves. I don’t know why, but it has happened that some beans would create a wild IBTS RoR curve, while others won’t. I’m actually not even interested in the why if the coffee is good. It’s always a trial and error. You try, you err and then, maybe, you find.
P. S. If you recall, could you tell me what happened on these roasts, as this behaviour does look odd.
 as i continue the back to back roasts. Also all my curves seem very noisy to me… is this normal?