I started using Python to analyze my roasts (load, calculate, clean up, display data) as I teach myself a bit of data analytics / data science. Cleaning and rearranging data was the bulk of my effort in the last few weeks. I’m slowly building my skills.
Luckily, I’ve been mostly consistent with ~500g roasts. There are always outliers and reasons for deviation but I’m starting to see a few nice trends and am having fun with it. Nothing wildly new. But clearer than tracking multiple overlays. For example:
I did a series of “unmanaged” roasts to investigate the effect of independently varying preheat, power, fan, and drum settings. Each was a 325g batch of Brazil Cerrado roasted without changing settings during the roast, all dropped at 218C IBTS. Not as fancy as your python study, but it was interesting to see for example how much increase in power is required to compensate for an increase in fan speed, or how much a 10C increase in preheat shortened time to FC. The results give you some intuition to use in real roasting where you’re changing settings during the roast and the situation becomes more complicated.
I agree there can be a relation but it’s likely minor and multi dimensional that isn’t seen here. As long as you have your machine in a long pre-heat, there are many other important factors that effect early roast parameters:
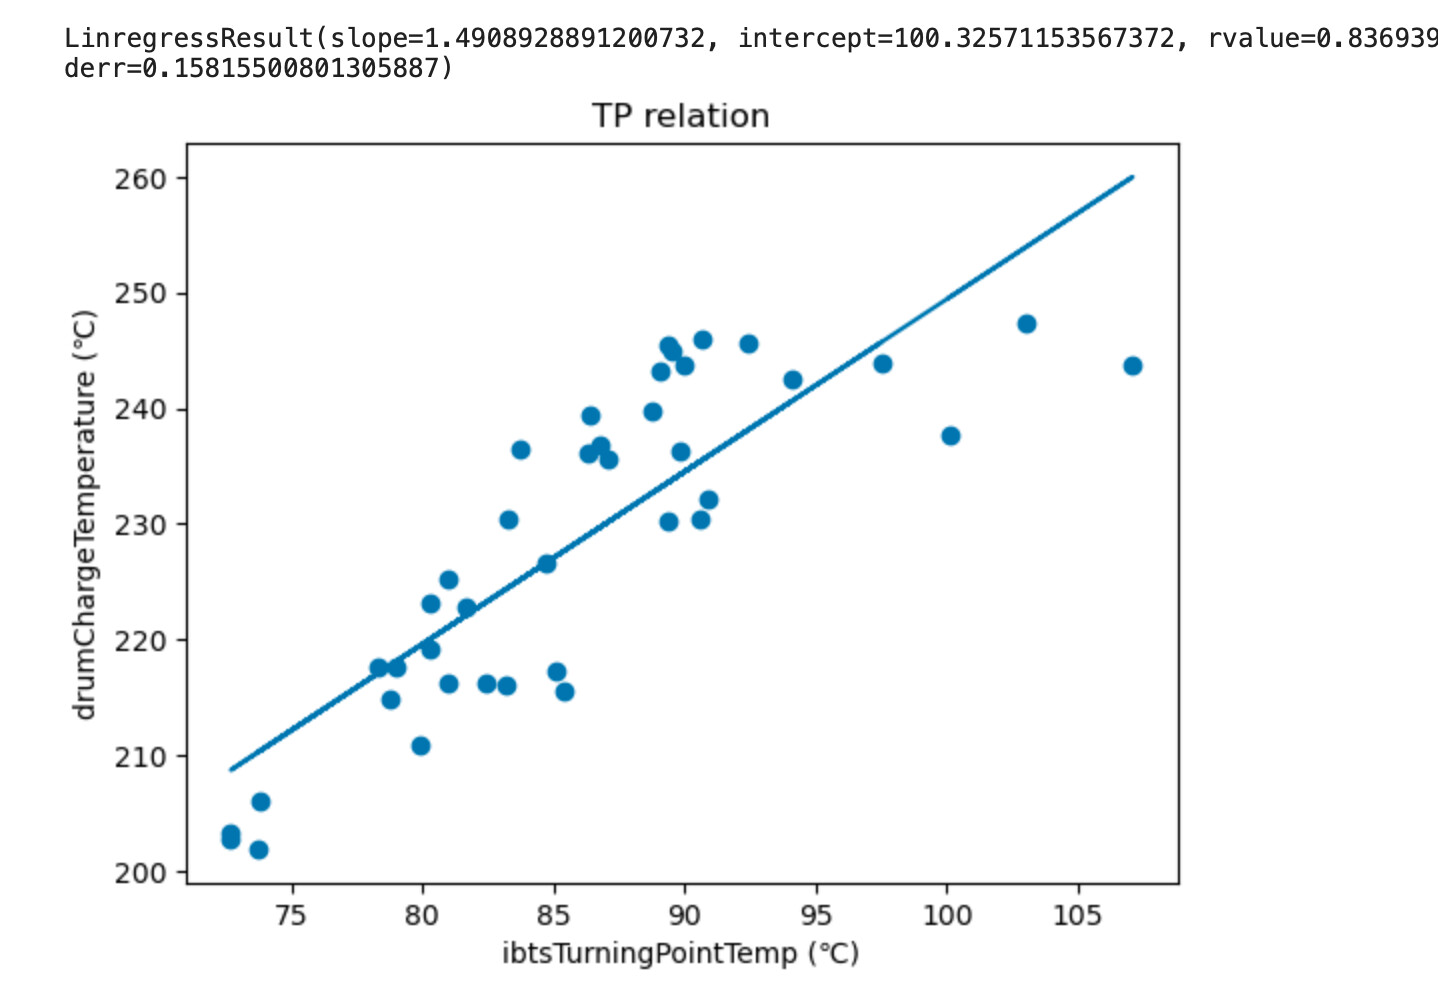
Still just playing with linear regression. Confirming that we should have tighter correlations with data points that are temporally close, especially early in the roast before you start mucking with settings. e.g. Strong positive correlation with charge temps and turning point temps.
no not of all the same bean. I typically am working on 10lbs of African beans, but they vary between washed and natural, Ethiopian and Kenyan.
They way I have it setup I can easily filter some results to specific Ethiopian naturals. However I’ve been on the road for the last 3 months and haven’t roasted or played with this for a while.
In September I’ll get back at it with more results.
If there’s not enough data to split them out into individual graphs, then you could colour each bean (or origin) differently, so you could more easily identify clusters.
@ryweller - I did some python based data analysis on the data I collected from my previous roaster (Behmor 1600), so I didn’t have the richness of data that the Bullet provides. But I did some analysis on things like bean weight and batch size and ambient temperature.
Turns out time in roaster was the only highly correlated factor for that… but it was the strongest correlation (like r values around 0.99999)!
I am interested in doing the same sort of exploration with the Bullet, when I get more than a few roasts under my belt.
How did you get the data? I’ve found the folder in RoasTime were it keeps a bunch of JSON files with roast data in there - but I would ideally like to ingest from roast.world directly if possible.
Also, have you looked at using the seaborn library? That gives prettier visualizations and lets you more readily do things like size and colour different subsets of your data.
It’s a bit sloppy because I was just learning Python and never got really good
It last worked on it about a year ago and noted that software updates may change the file formats or records recorded. But I think this should be good a good start. Also lots of data cleaning.
That’s great!
They say 80% of data science is just cleaning the data up enough to be useful
I want to use the data to help document my roast history as well as the data analytics, so I will probably build on what you’ve got there outside of a Jupyter notebook - the notes on things like isFork are hugely valuable time savers thanks!
I’ll report back with what I find!
And it looks like everyone is just working off the (obfuscated) json files on their computer - it would be good to know if we could hit up the Firebase back-end of roast.world
OK, so thanks to your help, I have managed to process all the roast information.
For starters, I am using it to automatically create labels, and to push some basic info out to a website.
Next step will be to recreate the roast profile graph.
I tried a variety of ways to automate taking a screenshot of the roast profile graph - but they’re doing something funky to generate it, so it’s not an element on the web page that I can find, and it refreshes every time you focus on the page, so the Selenium screengrabber only got blank screens
Nice one. I like that idea of generating information for a website or other display. You could probably use matplotlib, seaborn, or something to plot the roast profile as you wish it to be displayed. I’ve considered dashboards outside of roastime to help me track and compare notes of the same roast, but as you can tell I’ve fallen off the project.
Glad to the loading aspect was useful for your. Keep us updated or looking forward to others jumping in!
I originally wrote a very … targeted script (ie messy and hacky) just to prove the concept. I am still working to get the repo to the point where it replicates all the functionality of my prototype but now it’s at the point where it’s working and isn’t too embarrassing to share.
In addition to recreating the roast profile, I am looking at adding in the ability to save the data as a local markdown file as well as the option to push it to a Headless CMS.
Feel free to share ideas thoughts etc here - or in the github project if you’re motivated enough
Further news:
Library has been updated to have parity with my original hacky) script.
It now uses a three stage workflow
Extract the data from RT, compile it into Markdown files, and generate a label
Using a markdown Editor, you can create annotation .md files that will merge in with the auto generated content, so you can add in your own descriptions, scores, etc that we can’t keep in RT.
Using Gatsby, publish the content to the web!
So now there’s very little human intervention between roasting a coffee and having it appear on my website!
@themcclure this is so cool. I don’t have the focus to do something like this, but I feel like with enough data you could potentially figure out what kind of bean you roasted even if you had no prior knowledge of where it was from. I bet you could also use all this data to create a simple “wizard” where someone could input the beans origin, process, altitude, and variety, and it could output ideal temperatures possibly even scaling the data based on batch size. This would be such a useful tool for beginning with new beans.
Yeah, getting a large enough dataset to generate a “default overlay” for your first roast would be a great goal - but it would need a pretty broad dataset.
That’s one of the reasons I’m hoping to connect to the RW API rather than the files on the local RT - we might be able to query everyone else’s roasts to build the models.
@themcclure Thank you so much for talking about and sharing your efforts with this! I’m just getting started with a friend who owns the bullet and I’m also taking the headless cms approach (currently using DecapCMS but hoping SveltiaCMS matures and I can migrate to that eventually.
I don’t have anything to contribute other than my thanks for choosing markdown and python etc for these tools. Really awesome to find this.
I’m super glad the work has been useful. I built my website using Gatsby because it processed markdown files well.
If I rebuilt it, I might go for next.js instead but at the moment it’s running fine and doesn’t need to be more than it is.
Funny you should post today - I was just thinking of revisiting this thread this morning. I upgraded to RT 4 and my code wasn’t able to process the roast data anymore… I presume that’s just a minor fix to format, name, or location but before I spent time debugging it, I was meaning to ask here “has anyone else had encountered that?”
Wow that is great timing! I haven’t run into that snag yet but I’m still orienting myself but hopefully in the next week or two I’ll be able to try running some data through it.